Process
After several years working in the design industry, both in consultant & in-house roles, as well as teaching design, the graphic below was created to schematically explain the role of designers in the product development process to students & work partners or clients. The purpose is to visually represent the fluidity and iterative nature as well as the typical phases of the product development process.
The graph below is free to download under the Creative Commons Attribution-Non Commercial International 4.0 license (please read the terms if you want to use or download the image), you must provide credit and link to this source page as it may get updated.
Important notes:
- The activities & tasks listed are ONLY examples and they do NOT represent a comprehensive list of all the activities that happen in a given project. Every project is unique.
- The phases shown are examples of the typical, most common phases of a full product development process, but some design projects may only be focused on a few specific phases. In some projects more phases may be added or repeated, depending on the ambiguity of the problem or challenges encountered in pre-production.
- The duration of phases is not related to the graphic representation, for example: the manufacturing phases (hardware programs) are usually longer in duration than the creative synthesis phases, but they have been simplified in this graph for the purpose of focusing on the front end and creative synthesis prior to locking the final design which is where the majority of the designers impact and value add happens.
Click here to download the high resolution PDF.

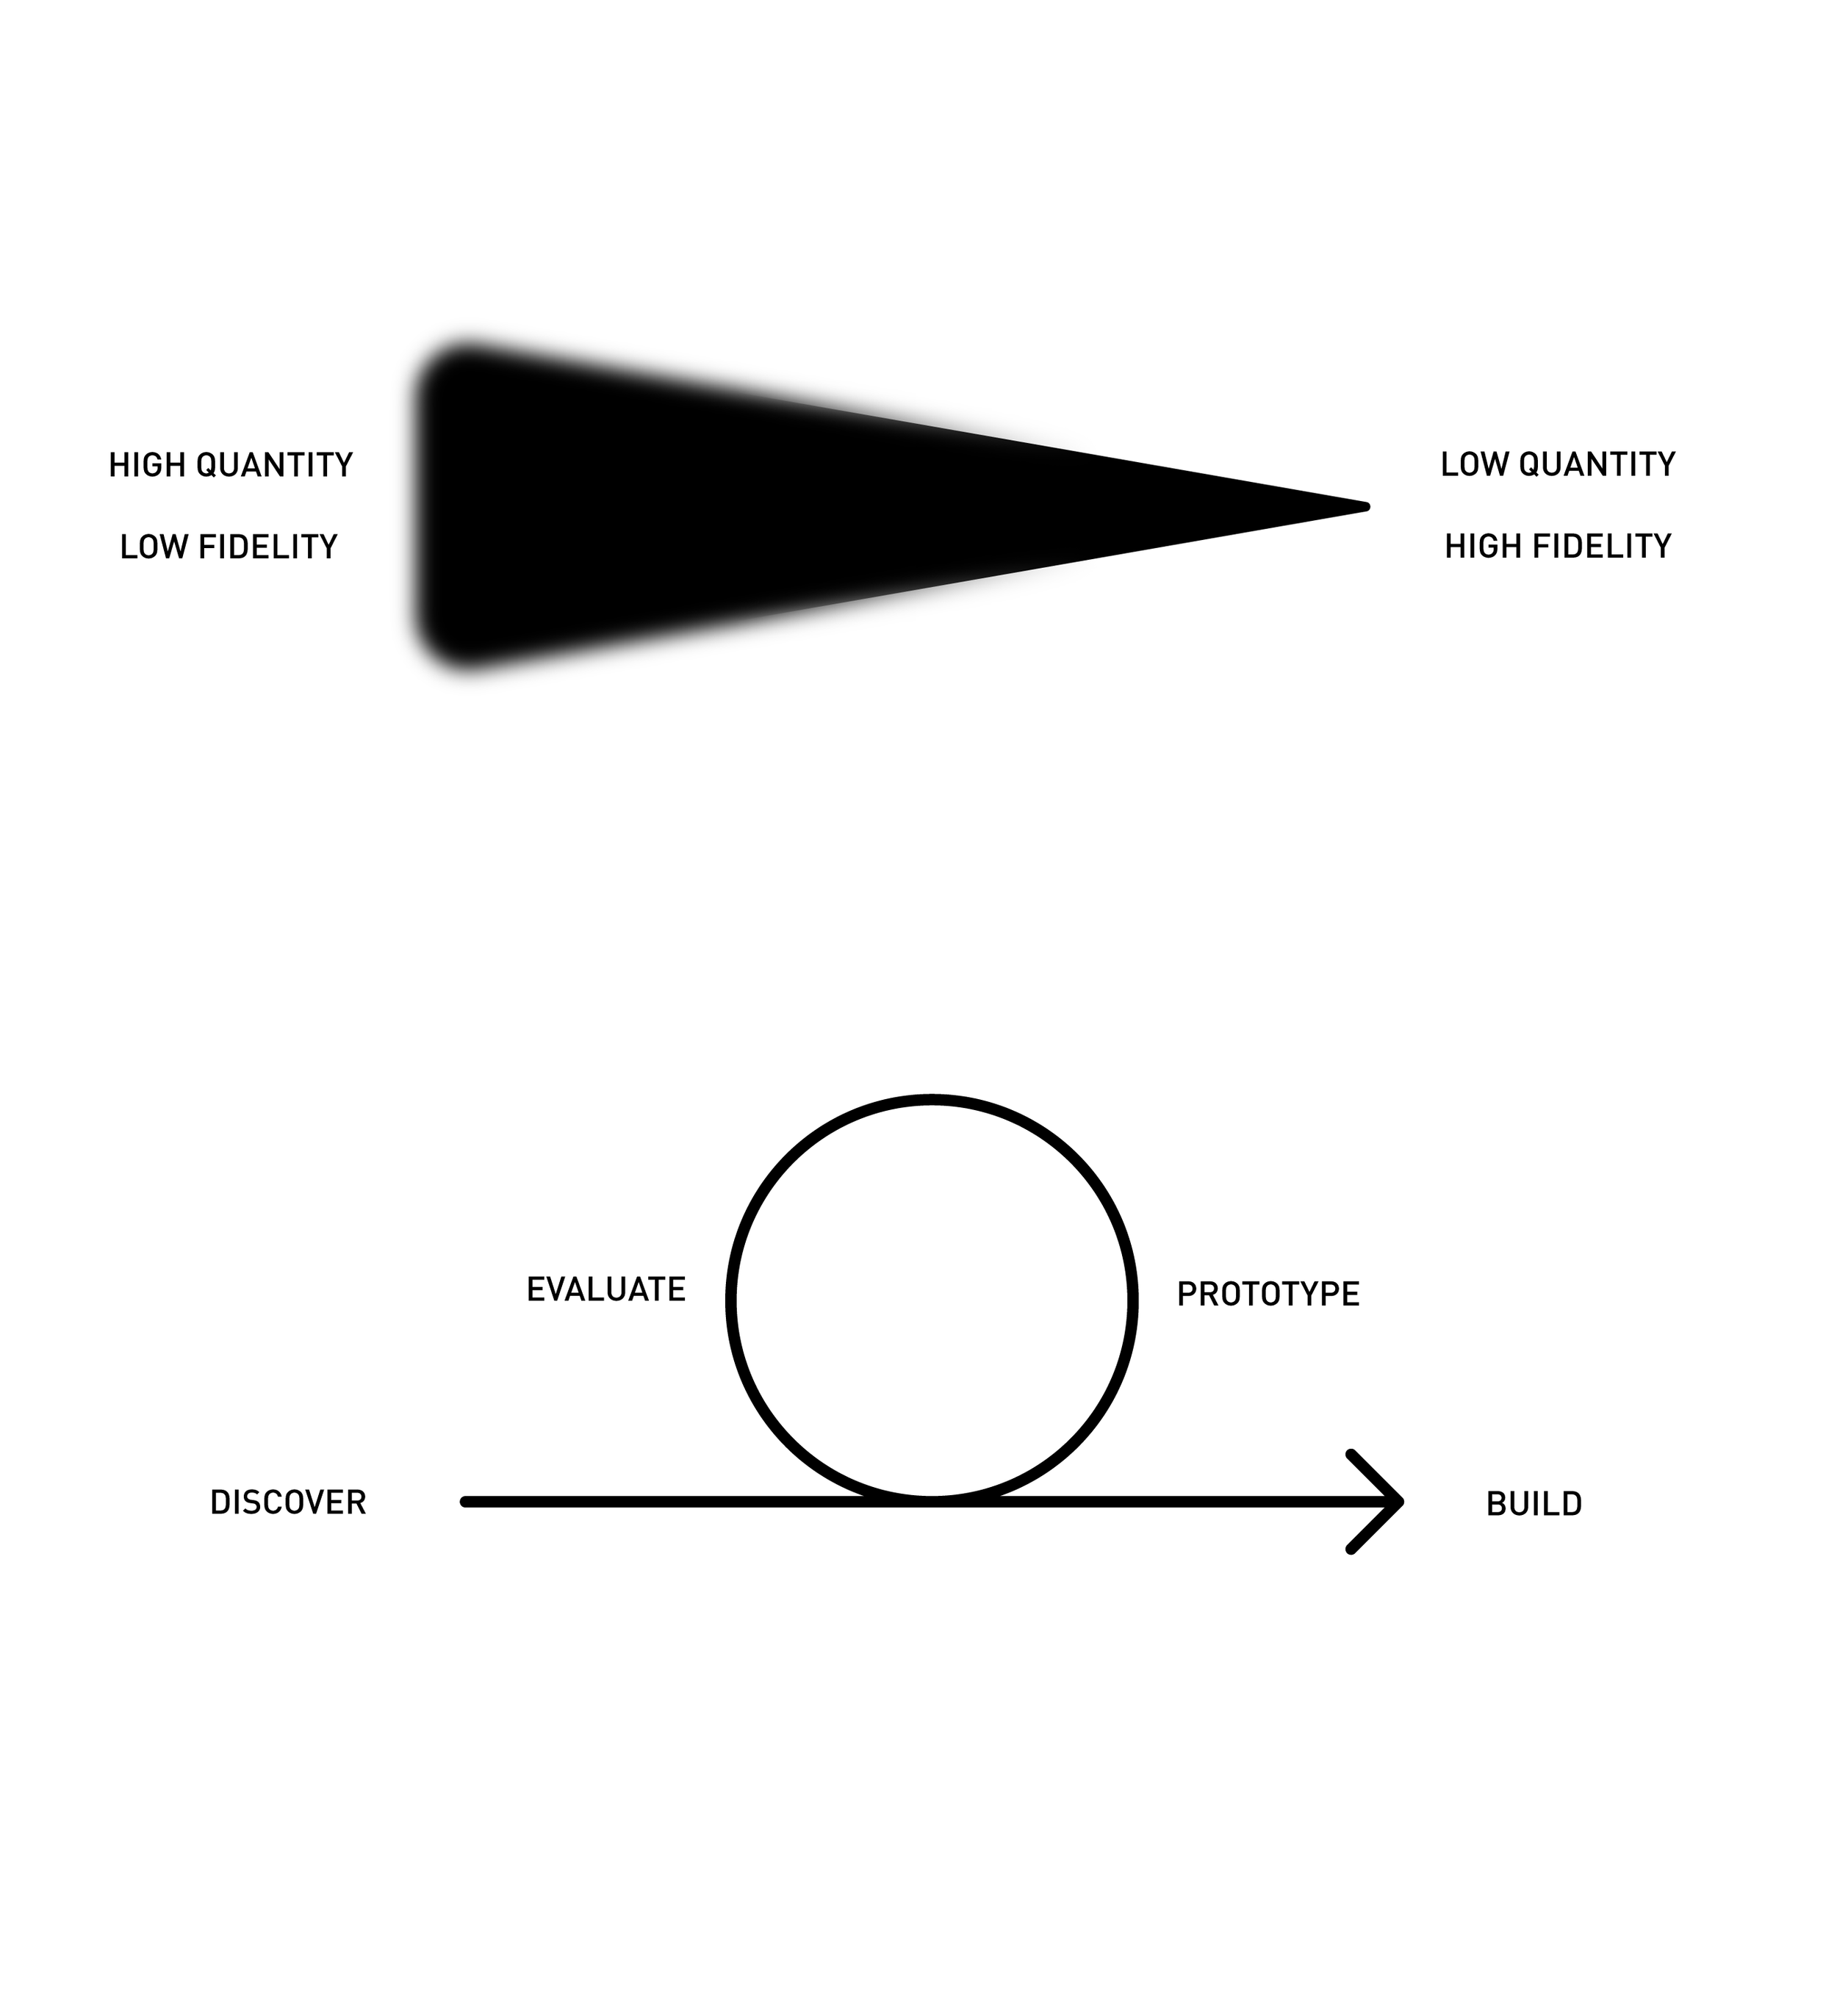
The purpose of the small additional graphs is to show other aspects related to the process:
a) Quantity and fidelity of ideas along the process and;
b) The iterative cycles (non-linear) or feedback loops.